Wiley Series in Probability and Statistics
5 primary works • 6 total works
Book 401
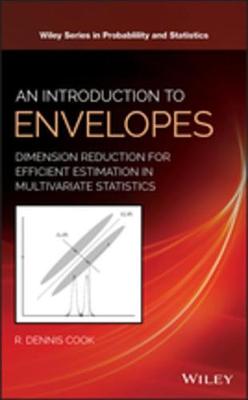
Written by the leading expert in the field, this text reviews the major new developments in envelope models and methods
An Introduction to Envelopes provides an overview of the theory and methods of envelopes, a class of procedures for increasing efficiency in multivariate analyses without altering traditional objectives. The author offers a balance between foundations and methodology by integrating illustrative examples that show how envelopes can be used in practice. He discusses how to use envelopes to target selected coefficients and explores predictor envelopes and their connection with partial least squares regression. The book reveals the potential for envelope methodology to improve estimation of a multivariate mean.
The text also includes information on how envelopes can be used in generalized linear models, regressions with a matrix-valued response, and reviews work on sparse and Bayesian response envelopes. In addition, the text explores relationships between envelopes and other dimension reduction methods, including canonical correlations, reduced-rank regression, supervised singular value decomposition, sufficient dimension reduction, principal components, and principal fitted components. This important resource:
* Offers a text written by the leading expert in this field
* Describes groundbreaking work that puts the focus on this burgeoning area of study
* Covers the important new developments in the field and highlights the most important directions
* Discusses the underlying mathematics and linear algebra
* Includes an online companion site with both R and Matlab support
Written for researchers and graduate students in multivariate analysis and dimension reduction, as well as practitioners interested in statistical methodology, An Introduction to Envelopes offers the first book on the theory and methods of envelopes.
Book 405
An Introduction to Regression Graphics
by R. Dennis Cook and Sanford Weisberg
Book 482
Other important features of this book include: Extensive coverage of a relatively new regression context based on dimension--reduction subspaces and sufficient summary plots Graphical regression, an iterative visualization process for constructing sufficient regression views Graphics for regressions with a binary response Graphics for model assessment, including residual plots Net--effects plots for assessing predictor contributions Graphics for predictor and response transformations Inverse regression methods Access to a Web site of supplemental plots, data sets, and 3D color displays. An ideal text for students in graduate--level courses on statistical analysis, Regression Graphics is also an excellent reference for professional statisticians.
Book 488
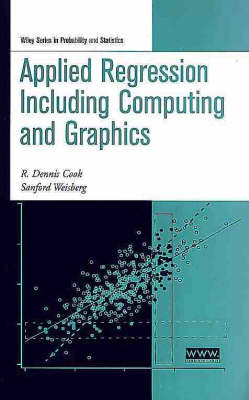
Applied Regression Including Computing and Graphics
by R. Dennis Cook and Sanford Weisberg
It is an invaluable resource for anyone interested in learning how to analyze regression problems with confidence and depth.
Book 528
In addition to illustrating these techniques, the book traces aspects of their development from classical statistical theory. 1985 (0 471-09776-4) 672 pp. Robust Regression and Outlier Detection Peter J. Rousseeuw and Annick M. Leroy An introduction to robust statistical techniques that have been developed to isolate or identify outliers. Emphasizes simple, intuitive ideas and their application in actual use. No prior knowledge of the field is required. Discusses robustness in regression, simple regression, robust multiple regression, the special case of one-dimensional location, and outlier diagnostics. Also presents an outlook of robustness in related fields such as time series analysis. Emphasizes "high-breakdown" methods that can cope with a sizable fraction of contamination. Focuses on the least median of squares method, which appeals to the intuition and is easy to use. 1987 (0 471-85233-3) 329 pp.


