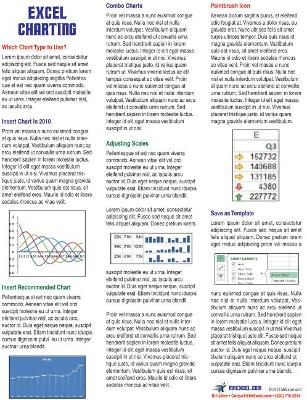
Excel is great at creating charts and graphs, but there are a dizzying 73 chart types available; this tip card teaches the reader when to choose which chart type. For example, to show trends over time, there are certain charts to use, but to show market segmentation, a 2-D pie chart should be used. The card also covers the new Excel 2013 charting interfaces and tiny charts called Sparklines, introduced in Excel 2010. Instructions are also included on how to quickly add traffic lights or other icon sets to bring a boring table of monochrome numbers to life.
- ISBN10 1615479988
- ISBN13 9781615479986
- Publish Date 1 October 2013
- Publish Status Inactive
- Out of Print 12 March 2021
- Publish Country US
- Imprint Holy Macro! Books
- Format Paperback
- Pages 2
- Language English
