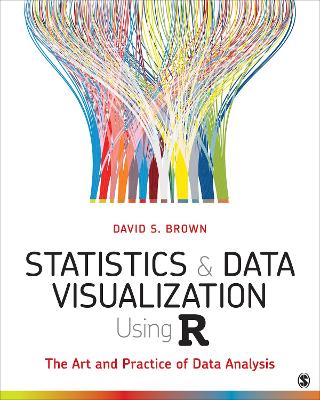
Designed to introduce students to quantitative methods in a way that can be applied to all kinds of data in all kinds of situations, Statistics and Data Visualization Using R: The Art and Practice of Data Analysis by David S. Brown teaches students statistics through charts, graphs, and displays of data that help students develop intuition around statistics as well as data visualization skills. By focusing on the visual nature of statistics instead of mathematical proofs and derivations, students can see the relationships between variables that are the foundation of quantitative analysis. Using the latest tools in R and R RStudio® for calculations and data visualization, students learn valuable skills they can take with them into a variety of future careers in the public sector, the private sector, or academia. Starting at the most basic introduction to data and going through most crucial statistical methods, this introductory textbook quickly gets students new to statistics up to speed running analyses and interpreting data from social science research.
- ISBN10 1544333846
- ISBN13 9781544333847
- Publish Date 24 August 2021
- Publish Status Active
- Publish Country US
- Imprint SAGE Publications Inc
- Edition Annotated edition
- Format eBook (EPUB)
- Language English
