Voices That Matter
3 total works
You’ll also get to peek into the creative process of some of the world’s most talented designers and visual journalists, including Condé Nast Traveler’s John Grimwade , National Geographic Magazine’s Fernando Baptista, The New York Times’ Steve Duenes, The Washington Post’s Hannah Fairfield, Hans Rosling of the Gapminder Foundation, Stanford’s Geoff McGhee, and European superstars Moritz Stefaner, Jan Willem Tulp, Stefanie Posavec, and Gregor Aisch. The book also includes a DVD-ROM containing over 90 minutes of video lessons that expand on core concepts explained within the book and includes even more inspirational information graphics from the world’s leading designers.
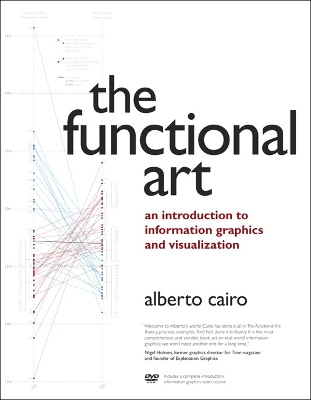
The first book to offer a broad, hands-on introduction to information graphics and visualization, The Functional Art reveals:
• Why data visualization should be thought of as “functional art” rather than fine art
• How to use color, type, and other graphic tools to make your information graphics more effective, not just better looking
• The science of how our brains perceive and remember information
• Best practices for creating interactive information graphics
• A comprehensive look at the creative process behind successful information graphics
• An extensive gallery of inspirational work from the world’s top designers and visual artists
On the DVD-ROM:
In this introductory video course on information graphics, Alberto Cairo goes into greater detail with even more visual examples of how to create effective information graphics that function as practical tools for aiding perception. You’ll learn how to: incorporate basic design principles in your visualizations, create simple interfaces for interactive graphics, and choose the appropriate type of graphic forms for your data. Cairo also deconstructs successful information graphics from The New York Times and National Geographic magazine with sketches and images not shown in the book.
No matter what your actual job title, you are—or soon will be—a data worker.
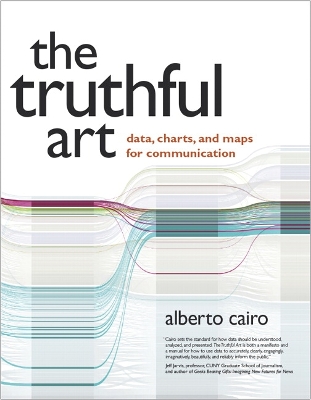
Every day, at work, home, and school, we are bombarded with vast amounts of free data collected and shared by everyone and everything from our co-workers to our calorie counters. In this highly anticipated follow-up to The Functional Art—Alberto Cairo's foundational guide to understanding information graphics and visualization—the respected data visualization professor explains in clear terms how to work with data, discover the stories hidden within, and share those stories with the world in the form of charts, maps, and infographics. In The Truthful Art, Cairo transforms elementary principles of data and scientific reasoning into tools that you can use in daily life to interpret data sets and extract stories from them.
The Truthful Art explains:
• The role infographics and data visualization play in our world
• Basic principles of data and scientific reasoning that anyone can master
• How to become a better critical thinker
• Step-by-step processes that will help you evaluate any data visualization (including your own)
• How to create and use effective charts, graphs, and data maps to explain data to any audience
The Truthful Art is also packed with inspirational and educational real-world examples of data visualizations from such leading publications as The New York Times, The Wall Street Journal, Estado de São Paulo (Brazil), Berliner Morgenpost (Germany), and many more.
You’ll also get to peek into the creative process of some of the world’s most talented designers and visual journalists, including Condé Nast Traveler’s John Grimwade , National Geographic Magazine’s Fernando Baptista, The New York Times’ Steve Duenes, The Washington Post’s Hannah Fairfield, Hans Rosling of the Gapminder Foundation, Stanford’s Geoff McGhee, and European superstars Moritz Stefaner, Jan Willem Tulp, Stefanie Posavec, and Gregor Aisch. The book also includes a DVD-ROM containing over 90 minutes of video lessons that expand on core concepts explained within the book and includes even more inspirational information graphics from the world’s leading designers.
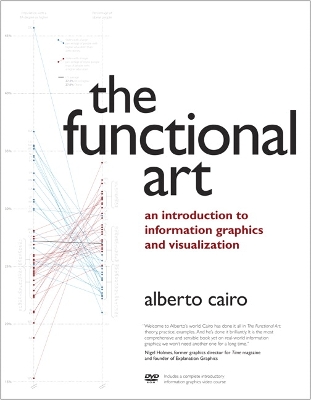
The first book to offer a broad, hands-on introduction to information graphics and visualization, The Functional Art reveals:
• Why data visualization should be thought of as “functional art” rather than fine art
• How to use color, type, and other graphic tools to make your information graphics more effective, not just better looking
• The science of how our brains perceive and remember information ¿
• Best practices for creating interactive information graphics
• A comprehensive look at the creative process behind successful information graphics ¿
• An extensive gallery of inspirational work from the world’s top designers and visual artists
On the DVD-ROM:
In this introductory video course on information graphics, Alberto Cairo goes into greater detail with even more visual examples of how to create effective information graphics that function as practical tools for aiding perception. You’ll learn how to: incorporate basic design principles in your visualizations, create simple interfaces for interactive graphics, and choose the appropriate type of graphic forms for your data. Cairo also deconstructs successful information graphics from The New York Times and National Geographic magazine with sketches and images not shown in the book.
All of Peachpit's eBooks contain the same content as the print edition. You will find a link in the last few pages of your eBook that directs you to the media files.
Helpful tips:
If you are able to search the book, search for "Where are the lesson files?"
Go to the very last page of the book and scroll backwards.
You will need a web-enabled device or computer in order to access the media files that accompany this ebook. Entering the URL supplied into a computer with web access will allow you to get to the files.
Depending on your device, it is possible that your display settings will cut off part of the URL. To make sure this is not the case, try reducing your font size and turning your device to a landscape view. This should cause the full URL to appear.