AK Peters Visualization
2 total works
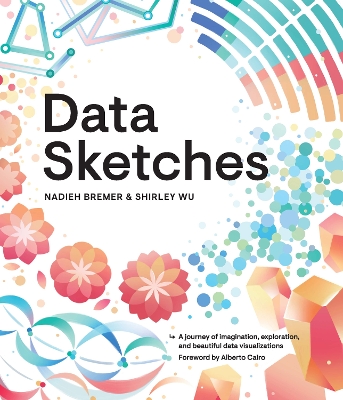
In Data Sketches, Nadieh Bremer and Shirley Wu document the deeply creative process behind 24 unique data visualization projects, and they combine this with powerful technical insights which reveal the mindset behind coding creatively. Exploring 12 different themes – from the Olympics to Presidents & Royals and from Movies to Myths & Legends – each pair of visualizations explores different technologies and forms, blurring the boundary between visualization as an exploratory tool and an artform in its own right. This beautiful book provides an intimate, behind-the-scenes account of all 24 projects and shares the authors’ personal notes and drafts every step of the way.
The book features:
- Detailed information on data gathering, sketching, and coding data visualizations for the web, with screenshots of works-in-progress and reproductions from the authors’ notebooks
- Never-before-published technical write-ups, with beginner-friendly explanations of core data visualization concepts
- Practical lessons based on the data and design challenges overcome during each project
- Full-color pages, showcasing all 24 final data visualizations
This book is perfect for anyone interested or working in data visualization and information design, and especially those who want to take their work to the next level and are inspired by unique and compelling data-driven storytelling.
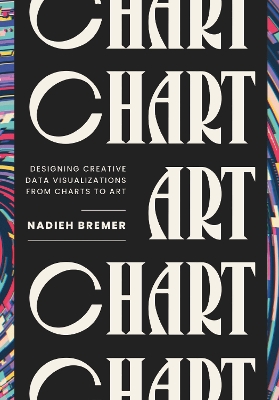
CHART is a guide to unleashing creativity in data visualization. It takes you on a journey along the spectrum from an ordinary chart to data art, packed with ways to bring more creativity into any visualization. It will help to make your visuals more compelling and memorable, long after the numbers have been crunched.
Drawing from over a decade of experience, the author shares thirteen hands-on, tool-agnostic lessons, each filled with actionable insights and unique perspectives. Between these core lessons, you’ll find tips, mini-chapters, and dozens of real-world examples from both client and personal projects. The book also includes exclusive glimpses into early sketches, works-in-progress, and in-depth design stories that reveal how creativity in data is often a messy, non-linear, but ultimately rewarding process.
CHART: Designing Creative Data Visualization from Charts to Art is designed for journalists, data analysts, business professionals, and newcomers alike, these lessons empower readers to push beyond the default. By the end of the book, you’ll have the tools and inspiration to transform typical charts and graphs into visuals that not only inform but also captivate and connect with your audience.
This book invites you to break the mold and think outside the chart.

