SpringerBriefs in Computer Science
3 total works
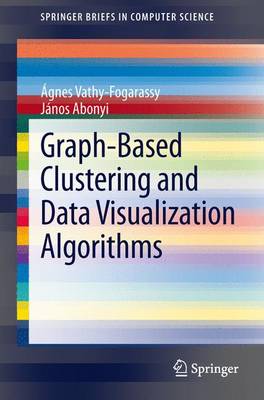
Graph-Based Clustering and Data Visualization Algorithms
by Agnes Vathy-Fogarassy and Janos Abonyi
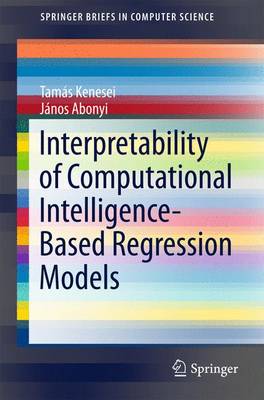
Interpretability of Computational Intelligence-Based Regression Models
by Tamas Kenesei and Janos Abonyi
The key idea of this book is that hinging hyperplanes, neural networks and support vector machines can be transformed into fuzzy models, and interpretability of the resulting rule-based systems can be ensured by special model reduction and visualization techniques. The first part of the book deals with the identification of hinging hyperplane-based regression trees. The next part deals with the validation, visualization and structural reduction of neural networks based on the transformation of the hidden layer of the network into an additive fuzzy rule base system. Finally, based on the analogy of support vector regression and fuzzy models, a three-step model reduction algorithm is proposed to get interpretable fuzzy regression models on the basis of support vector regression.
The authors demonstrate real-world use of the algorithms with examples taken from process engineering, and they support the text with downloadable Matlab code. The book is suitable for researchers, graduate students and practitioners in the areas of computational intelligence and machine learning.
Network-Based Analysis of Dynamical Systems
by Daniel Leitold, Agnes Vathy-Fogarassy, and Janos Abonyi
This book explores the key idea that the dynamical properties of complex systems can be determined by effectively calculating specific structural features using network science-based analysis. Furthermore, it argues that certain dynamical behaviours can stem from the existence of specific motifs in the network representation.
Over the last decade, network science has become a widely applied methodology for the analysis of dynamical systems. Representing the system as a mathematical graph allows several network-based methods to be applied, and centrality and clustering measures to be calculated in order to characterise and describe the behaviours of dynamical systems.
The applicability of the algorithms developed here is presented in the form of well-known benchmark examples. The algorithms are supported by more than 50 figures and more than 170 references; taken together, they provide a good overview of the current state of network science-based analysis of dynamical systems, and suggest further reading material for researchers and students alike. The files for the proposed toolbox can be downloaded from a corresponding website.


