Science in Infographics
12 total works
Welcome to the world of infographics! This exciting form of data visualisation uses icons, pictograms and graphics to present information in a whole new way. Read about how gravity keeps the planets orbiting the Sun, find out how machines make life easier, and discover how magnets work - all visualised in beautifully designed infographics!
Ideal for children of 9+, and fact and science geeks of all ages, finding out about forces has never been more exciting!
Welcome to the world of infographics! This exciting form of data visualisation uses icons, pictograms and graphics to present information in a whole new way. Read about the states of matter, find out how substances change state, and discover the different properties of materials - all visualised in beautifully designed infographics.
Ideal for children of 9+, and fact and science geeks of all ages, finding out about materials has never been more exciting!
Welcome to the world of infographics! This exciting form of data visualisation uses icons, pictograms and graphics to present information in a whole new way. Read how living things make more of themselves, explore how animals can live in large groups, and discover how food webs work - all visualised in beautifully designed infographics.
Ideal for children of 9+, and fact and science geeks of all ages, finding out about living things has never been more exciting!
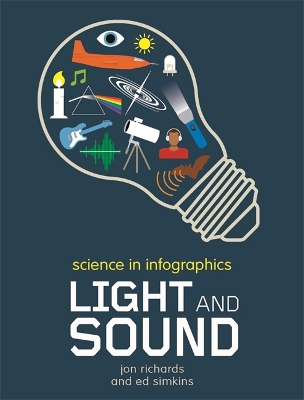
Welcome to the world of infographics! This exciting form of data visualisation uses icons, pictograms and graphics to present information in a whole new way. Wonder at the speed of light, read about sound waves and how we hear them, and discover how shadows are formed - all visualised in beautifully designed infographics.
Ideal for children of 9+, and fact and science geeks of all ages, finding out about light and sound has never been more exciting!
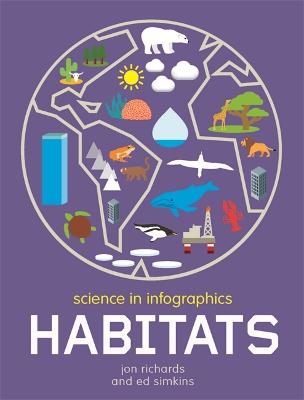
Welcome to the world of infographics! This exciting form of data visualisation uses icons, pictograms and graphics to present information in a whole new way. Wonder at the depth of the deepest oceans, read about huge grasslands, and discover how living things survive - all visualised in beautifully designed infographics.
Ideal for children of 9+, and fact and science geeks of all ages, finding out about forces has never been more exciting!
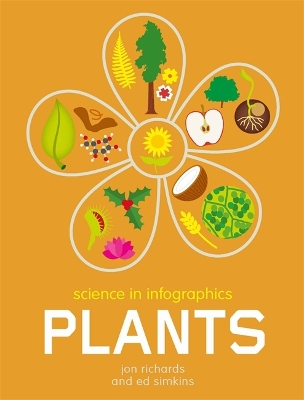
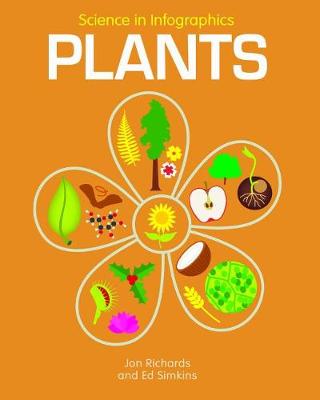
Welcome to the world of infographics! This exciting form of data visualisation uses icons, pictograms and graphics to present information in a whole new way. Read about the tallest and the smallest plants, see how flowers produce seeds, and discover how plants make energy - all visualised in beautifully designed infographics.
Ideal for children of 9+, and fact and science geeks of all ages, finding out about plants has never been more exciting!